Images & Graphics (Cognex)
Configuration of images & graphics (Cognex)
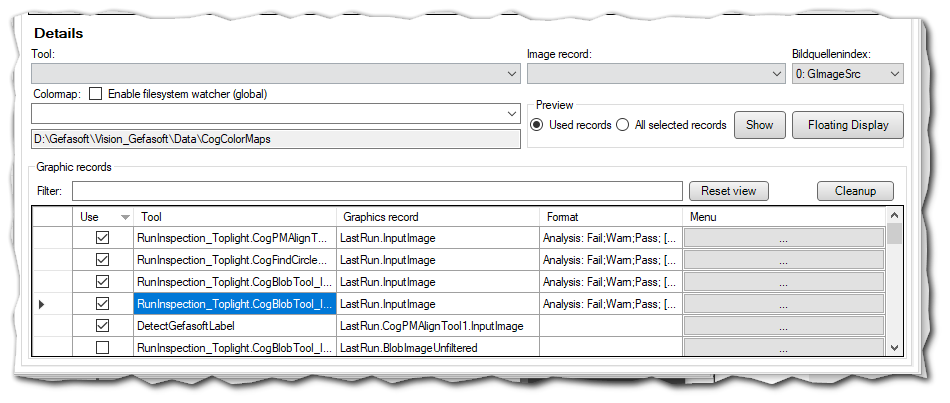
In the Images & Graphics (Cognex) subdisplay, different records, image sources and graphics can be selected to be displayed over the image.
Records
Tool: Selection of the VisionPro tool for the Image Record.
Image Record: “Image Record” of the tool to be displayed. Only records with an image can be selected here.
Image Source: Selection of an image source. The output image of this image source is used
as standard live image
as a display screen if the job was terminated due to a runtime error (RunError).
Note
If a tool is used but no image source is specified, no image will be displayed if an error occurs.
ColorMaps
Colormap: Selection of a configuration file for a ColorMap to be used for image display. The ColorMap is applied to 16-bit or range images and can be created and saved from the context menu of any CogDisplay.
Enable FileSystemWatcher (global): If this option is active, changes to the selected ColorMap file are detected and applied directly.
Preview
A preview of the records can be displayed.
Show Preview within this window
Floating Display Preview in an extra window
Used Records Show all records that are marked as “Used”.
All selected Records Show all selected records.
Graphic Records
Filter: Filters the display according to the entered value. The search is not case sensitive.
Reset View: Resets the filter
Cleanup: Selected but deleted graphics are still kept in the list. This button allows you to delete such entries.
Use: Activates the selected graphic
Tool: The VisionPro Tool, to which the Record belongs
Graphics record: Record
Format:
…:: Context menu for editing the format
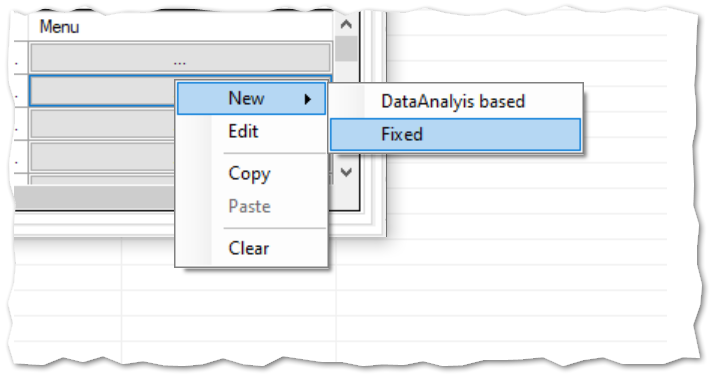
Formatting
The formatting of the graphics in the records can be overwritten:
Fixed formatting:
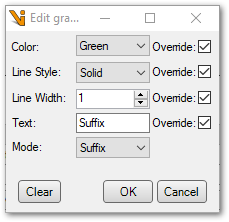
Override: Specifies whether the respective property should be overridden.
Color: Color of the graphics
LineStyle: Line style of the graphics
LineWidth: Line width of the graphics
Text: TipText of the graphics
Mode: How to overwrite the already existing TipText:
Prefix: The specified text is inserted before the existing text.
Suffix: The specified text is appended to the existing text.
Override: The existing text is overwritten.
DataAnalysis based:
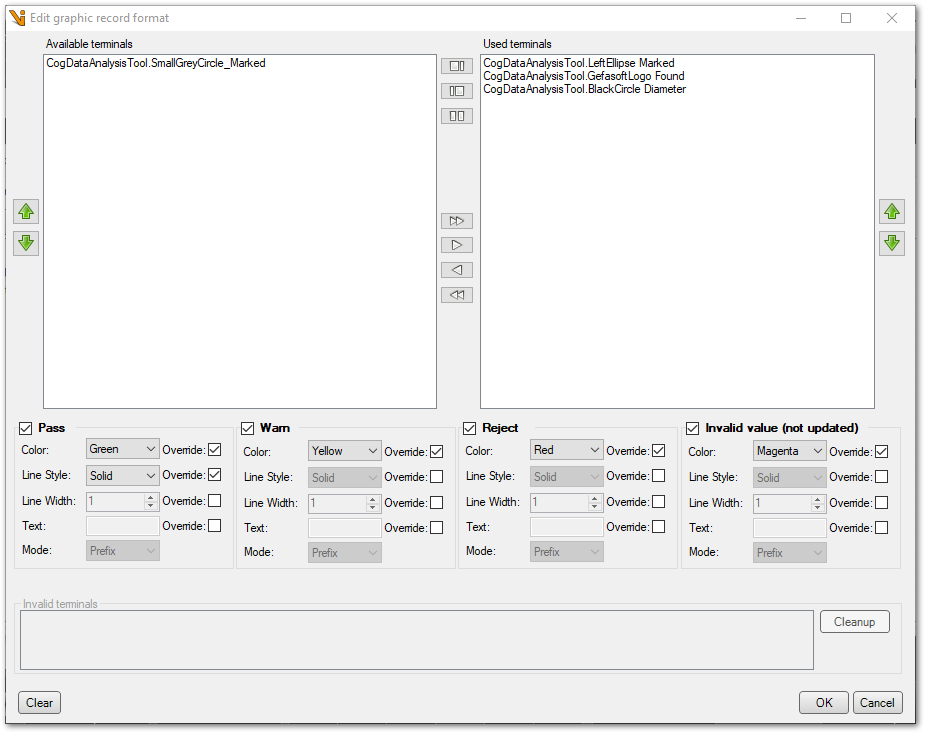
Values are formatted differently depending on the DataAnalysis results. Which DataAnalysis terminals are decisive for this can be set under Terminals.
All available DataAnalysis terminals are displayed. Terminals that are to be used for the evaluation must be added to the Used Terminals.
Under Display, you can then specify the formatting for each of the four possible evaluation results. The formatting settings correspond to those of the fixed formatting.