Diagram SubDisplay
With this SubDisplay, data generated in a job can be displayed over time. There are different types of chart views, which mainly differ in the origin of the data:
Trend diagram (Fixed)
Configuration
Contents of the SubDisplay
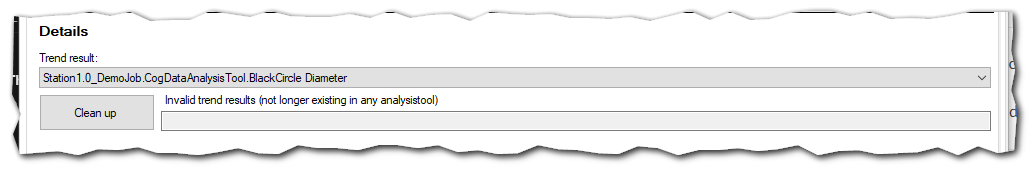
You can select which trend is to be displayed.
Note
The extended trends must be activated in JobEditor.
The preselection does not allow the operator to change the SubDisplay.
Trend diagram (Selective)
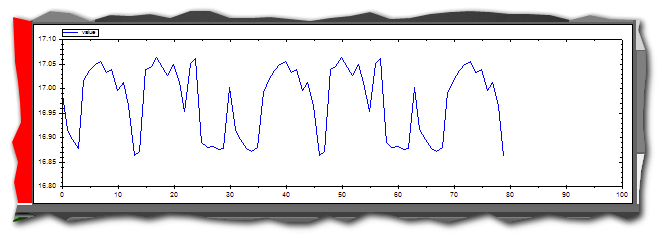
All activated trend results can be displayed by the operator in the SubDisplay through a drop-down menu.
The configuration is omitted.
Trend diagram extended
Configuration
Contents of the SubDisplay
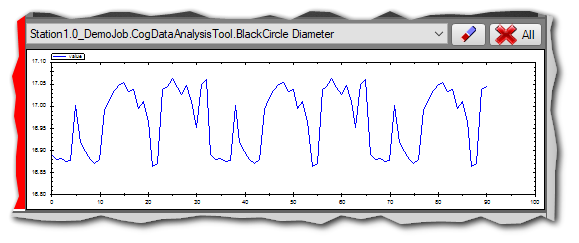
First, curves must be configured for the data sources. Then an extended trend can be selected as the data source for a curve.
To assign a data source, a curve must be selected. Subsequently, in the properties window of this curve, the Name in the drop-down can be set to an extended trend.
Note
The extended trends must be activated in JobEditor.
Diagram (from script)
Configuration of the diagram of script
First, curves configured must be created, which are then filled with data by a script. The names of the configured curves must be unique.
To fill this curve with data, the AddCurveToActiveJobResult_SimpleScript (Gefasoft/Script Templates) is added to the process in the toolgroup. This provides the following method:
bool AddCurve(string curveName, double[] xVals, double[] yVals);
This method can be called in the script with the name of the curve to be filled and the X, Y data.
Transfer parameter:
curveName: The name of the curve that has been created in the settings.
xVals: The X values
yVals: The Y values:
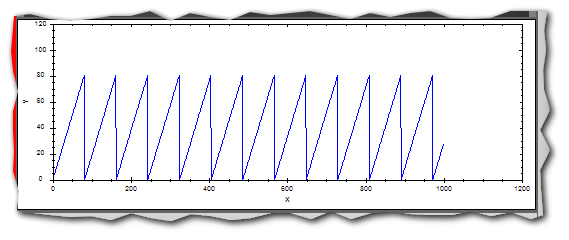
Example: Draw a zig zag curve with Y values between 0 to 80 and X values between 0 to 1000.
int cnt = 1000;
double[] valsX = new double[cnt];
double[] valsY = new double[cnt];
int y = 0;
for(int i = 0;i < cnt;i++)
{
  valsX[i] = i;
  valsY[i] = y++;
  if(y > 80) y = 0;
}

this.AddCurve("Curve1", valsX, valsY);
Result:
Contents of the SubDisplay
Trend diagram extended 2D coordinates
Configuration

Contents of the SubDisplay
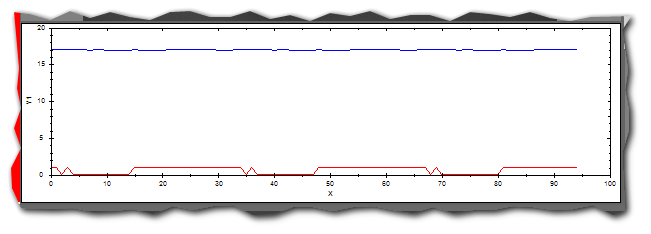
Visualization of 2D coordinates. For this, one source for the X and one for the Y coordinate must be selected per data source.
New points lose visibility over time.
Note
Wobble circle tests can be visualized well with this SubDisplay.
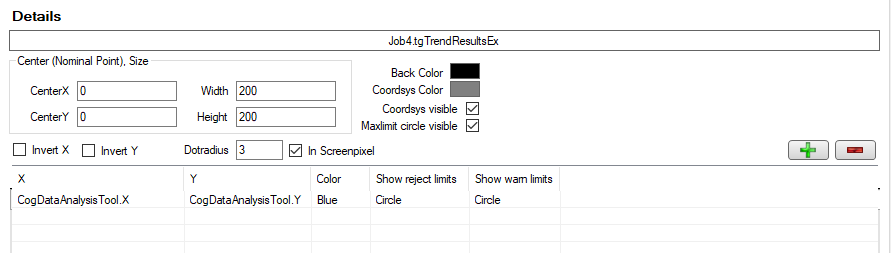
Configuration
CenterX: X Center of the 2D coordinate system
CenterY: Y Center of the 2D coordinate system
Width: Width of the diagram
Height: Height of the diagram
Invert X: Invert X value
Invert Y: Invert Y value
Dot Radius: Radius of the dots
BackColor: Background color of the diagram
Coordsys Color: Color of the axes of the coordinate system
Coordsys Visible: Show coordinate system
Maxlimit Circle Visible: Show Limits
+: Add new data source
-: Delete selected data source
Note
Height and width are coupled with each other.
Data Sources:
X: Source for the X coordinate
Y: Source for the Y-coordinate
Color: Color
Show reject limits: Show limits for the reject level
Show warn limits: Show warn limits
Create curves
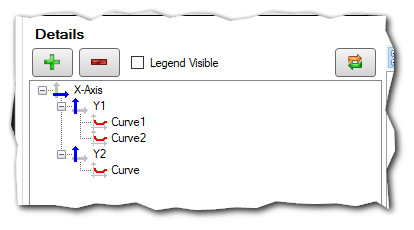
Creating an X-axis:
Auto-Scale: Select scaling automatically
Axis Visible: Show Axis
Major Step: Step Size (Major)
Max: Maximum value
Min: Minimum value
Minor Step: Step Size (Minor)
Name: Axis name
Title Visible: Show axis title
There is a fixed X-axis that is already defined.
Creating a Y-axis:
Multiple X-Axes can be created for the X-Axis. (Select X-axis, then click Add button (+))
Several Y-axes can be defined for the fixed X-axis. These are defined by marking the entry X-Axis and clicking the “+” button.
Auto-Scale: Select scaling automatically
Axis Visible: Show Axis
Major Step: Step Size (Major)
Max: Maximum value
Min: Minimum value
Minor Step: Step Size (Minor)
Name: Axis name
Title Visible: Show axis title
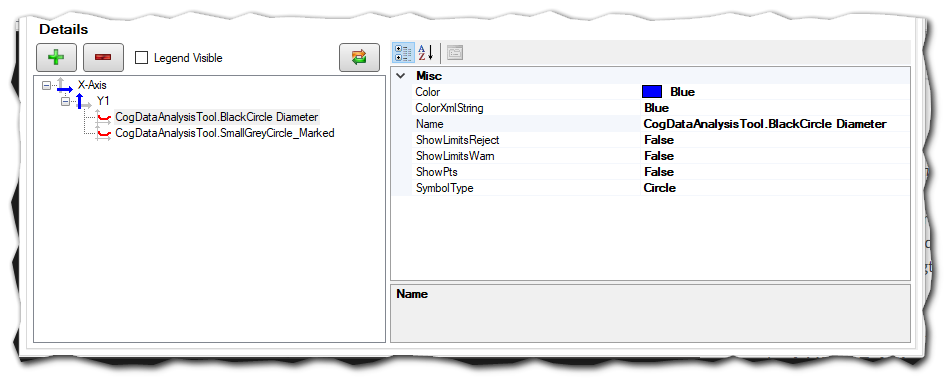
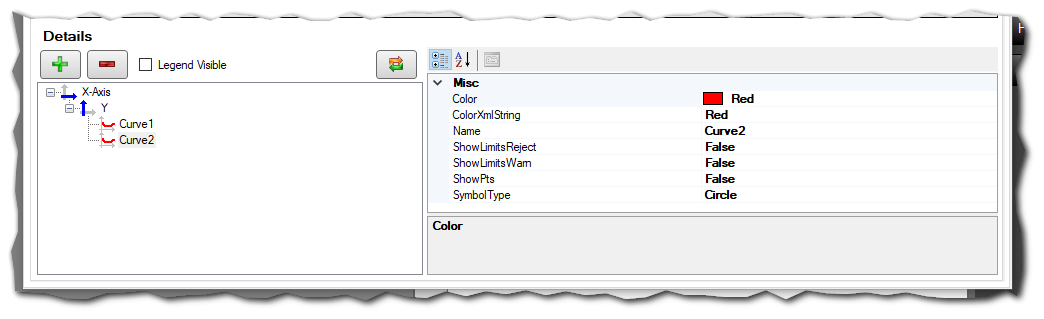
Creating a curve:
Several curves can be created for the Y-axis. (Select Y-axis, then click the Add button (+)).
Color: Color of the curve
Name: Unique name of the curve
Show Limits Reject: Show Data Analysis Tool reject limits for data in chart
Show Limits Warn: Show Data Analysis Tool warning limits for data in chart.
Show Pts: Show individual points
Symbol Type: Symbol of the points